Live Solar and Aurora Images
The Sun and the aurora as they look right now, in many wavelengths, from NASA and NOAA satellites. Images refresh automatically while the page is open.
The Sun in many wavelengths (NASA SDO)
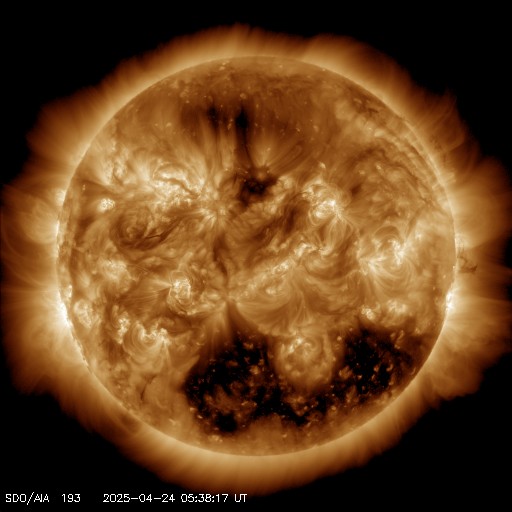
Corona and hot flare plasma. Coronal holes appear dark: the source of fast solar wind streams.
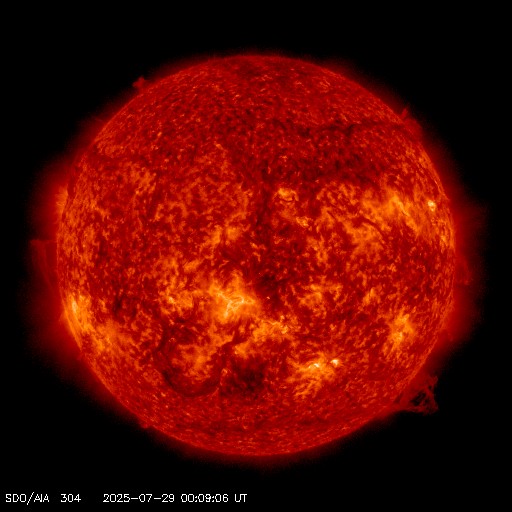
Chromosphere and transition region. Shows prominences and filaments at the limb.
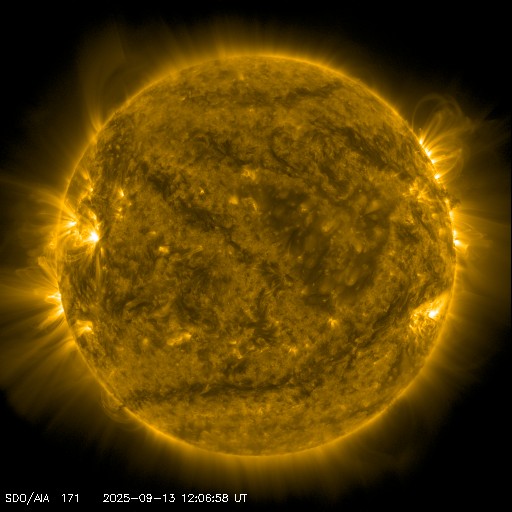
Quiet corona and coronal loops tracing the magnetic field.
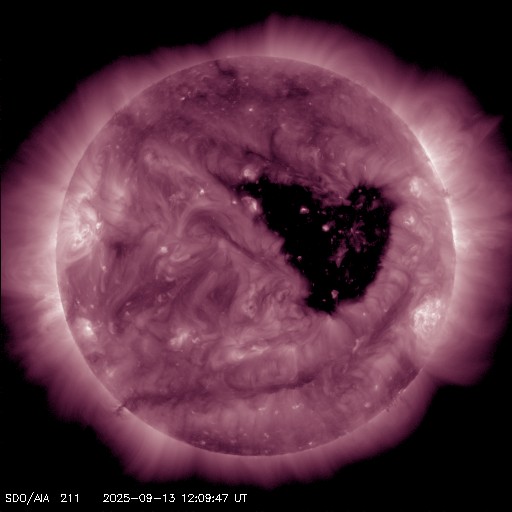
Hot active-region corona.
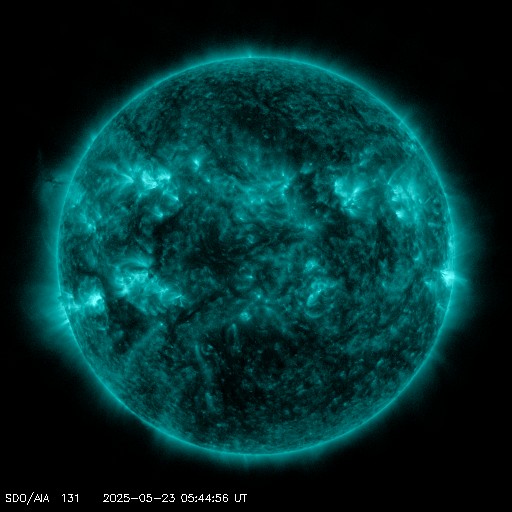
Flaring regions: the hottest plasma, bright during flares.
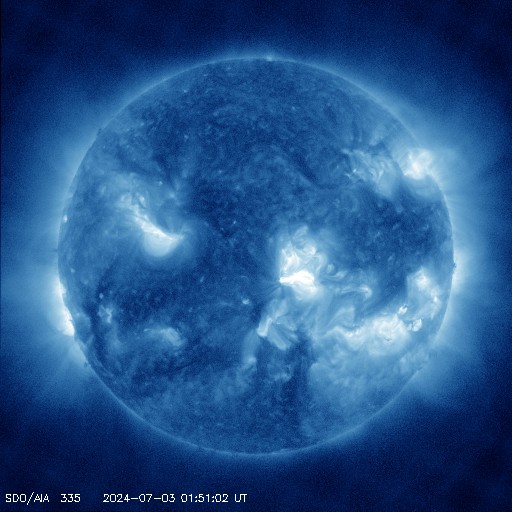
Active region corona.
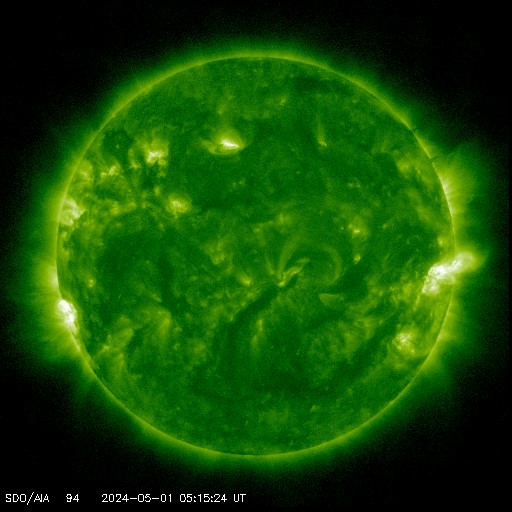
Very hot flare plasma.
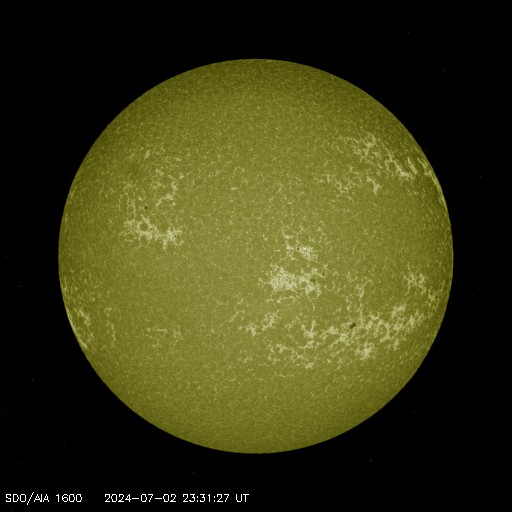
Upper photosphere and transition region.
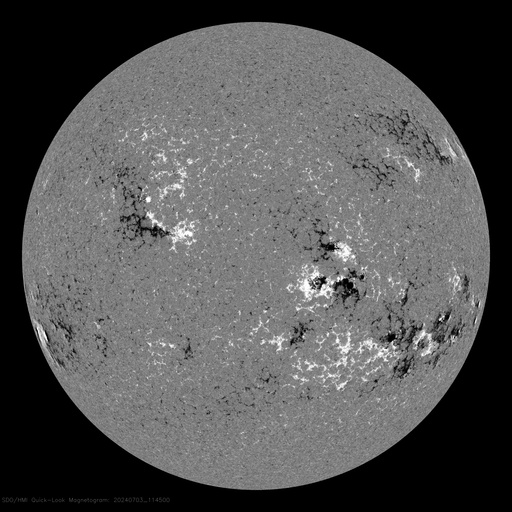
Magnetic polarity on the visible surface: complex regions are flare-prone.
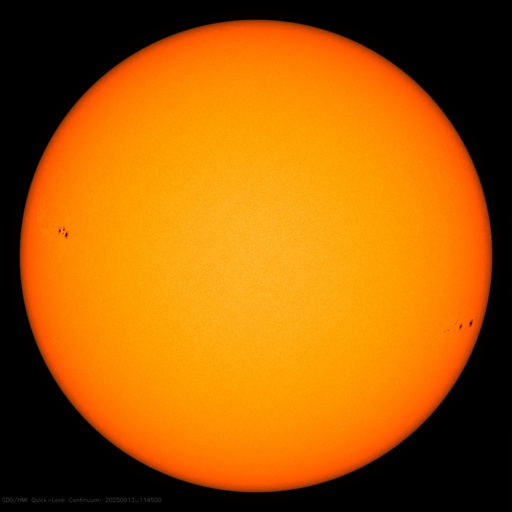
Visible light: sunspots as dark patches.
Solar corona and CMEs (SOHO LASCO)
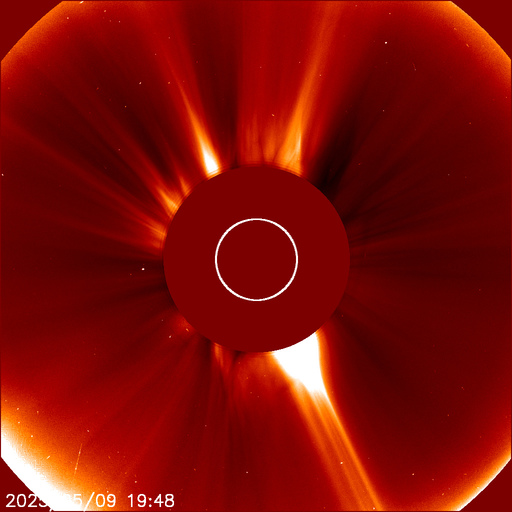
Inner corona. Expanding bright clouds are coronal mass ejections.
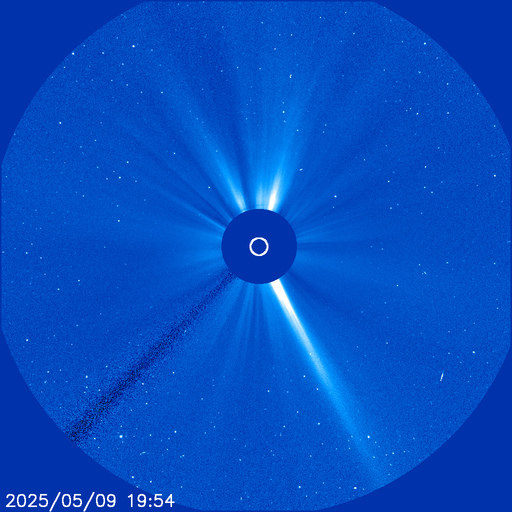
Outer corona out to about 30 solar radii.
NOAA SUVI and the aurora ovals
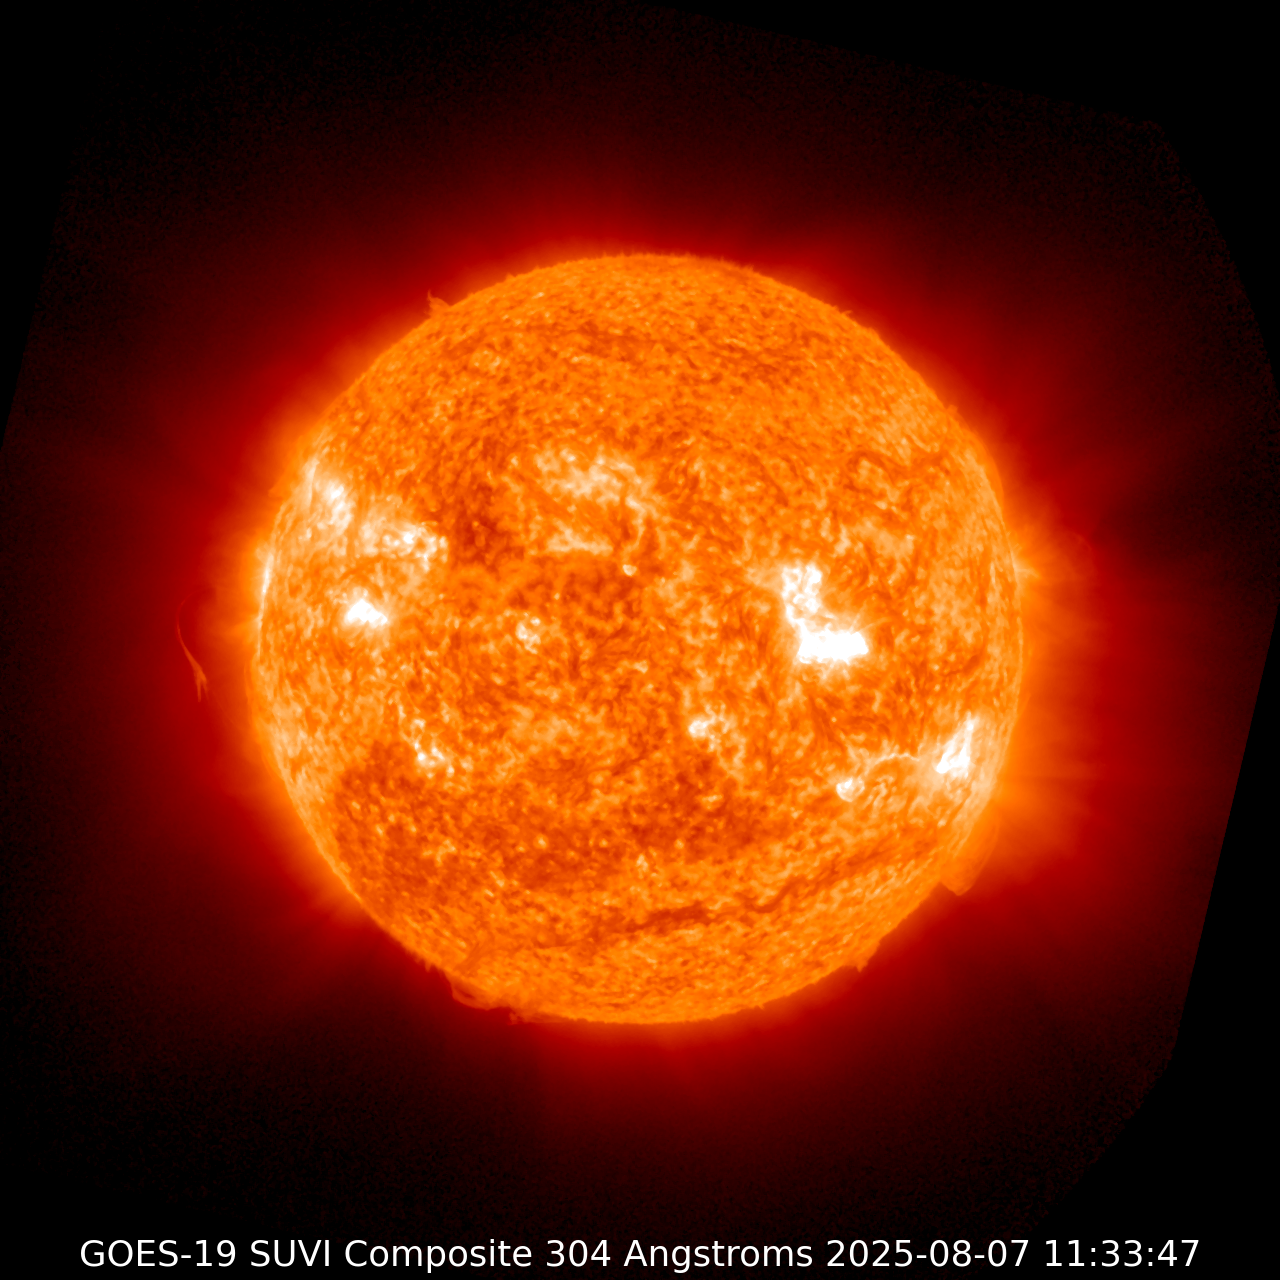
NOAA operational view of the Sun at 304 Å.
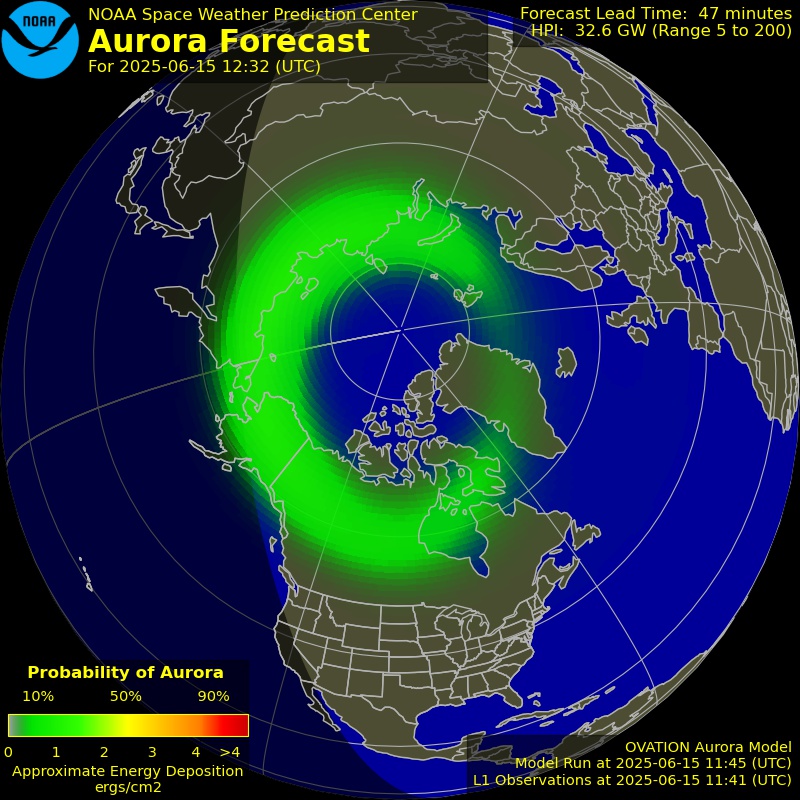
OVATION model forecast of the northern auroral oval.
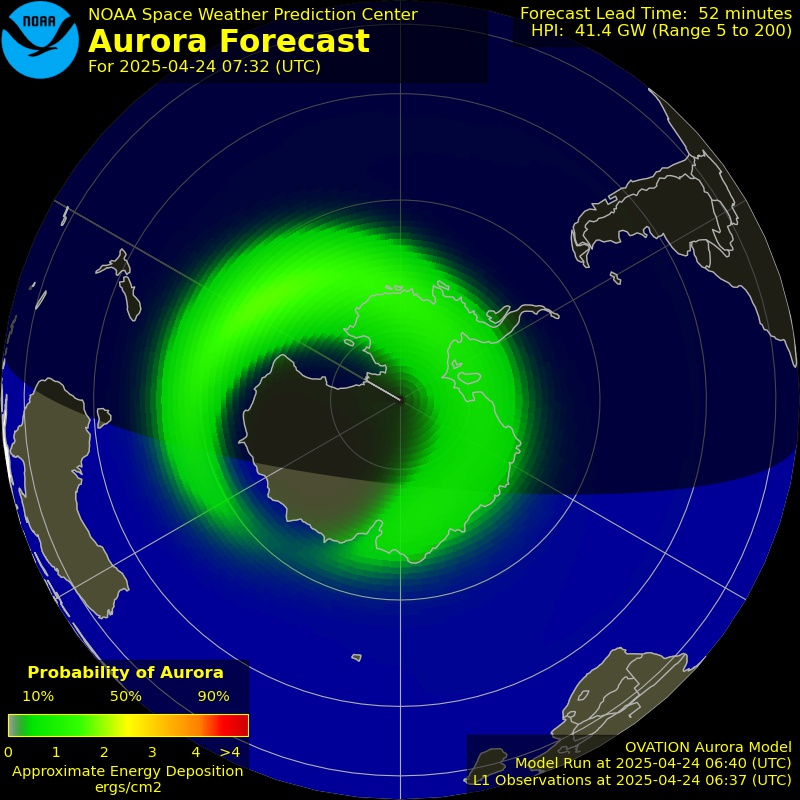
OVATION model forecast of the southern auroral oval.
What to look for
Coronal holes (dark regions in 193 Å) release fast solar wind that can raise the Kp index two to four days after they face Earth. Active regions with complex magnetic fields (see the HMI magnetogram) are the likely source of flares: check the X-ray flux when you see them. Coronal mass ejections in LASCO images that expand all around the Sun are directed at or away from Earth and can drive a geomagnetic storm.
Images: NASA Solar Dynamics Observatory, ESA/NASA SOHO, NOAA SWPC. Each image belongs to its source and is loaded directly from their servers.
Data: NOAA Space Weather Prediction Center, NASA SDO. Band conditions are estimates computed by Map For HAM and are indicative only. Methodology and credits · Data feeds · Widgets
Sostieni MFH ❤️
Puoi supportare la piattaforma con una donazione. Il tuo contributo sarà di grande aiuto!
Se sei registrato, per favore indica il tuo callsign o indicativo.




HOME • EMAIL • MAP • APP • T&C • ASG ID • HELP
2020-2026 MapForHam.com
Developed by IU1FIG • Diego Rispoli
☎ +39 340 2434255 (italian language only)